Collecting Dallas Officer-Involved Shootings
The Dallas Police Department posts tabular data and summaries of every officer-involved shooting since 2003. Write a script to collect the data, including the PDF summaries associated with each incident. Then parse the data into three tables: incidents, officers, and suspects (as more than one officer and suspect can be involved in an incident). Then create a webpage displaying the aggregated information.
The scraping involved is straightforward. And we’ve extracted text from PDFs before. This is primarily an exercise in showing how public data can be made more useful, both for analysis and for storytelling.
Deliverables
A project folder named dallas-ois
The folder structure will look like this:
  |- compciv/
    |- homework/
      |-- dallas-ois/
              |-- scraper.sh (gets the web pages and PDFs)
              |-- geocoder.sh (finds the lat/lng coordinates)
              |-- tablemaker.sh (cleans up the data, parses the PDFs, creates PSV files)
              |-- pagemaker.sh (puts together a webpage)
              |-- data-hold/
                  |-- ois_2003.html (etc. etc., all the ois pages)
                  |-- pdfs/ (to store all the pdfs)
              |-- tables/
                  |-- suspects.psv
                  |-- incidents.psv
                  |-- officers.psv
                  |-- locations.psv
scraper.sh
This script downloads the page at www.dallaspolice.net/ois/ois.html and all the past year pages in the sidebar (/ois/ois_2003.html through /ois/ois_2012.html). Each incident has a narrative case file attached as a PDF, so download all of these PDFs into data-hold/pdfs. These files will all be parsed by tablemaker.sh
geocoder.sh
NOTE (March 10, 2015): I talk about creating a separate geocodes.psv file as a result of this script. That’s easy enough to do but in the big picture, might seem redundant. You don’t need to produce that PSV as a result of this script if you don’t feel like it’s necessary.
This script reads every row from the collected OIS HTML files and extracts a list of all Locations. It then connects to the Google Geocoder API or the Mapquest Geocoding API and retrieves the latitude and longitude coordinates for each location.
The result should be a file named tables/geocodes.psv that looks like this:
    location|latitude|longitude|
    2502 Grand Avenue|32.768664|-96.77459700000001
    2700 Medill Street|32.7752948|-96.7673241
tablemaker.sh
This script will read the data gathered by scraper.sh and create three pipe-delimited files:
tables/incidents.psv
This contains all of the fields as seen on dallaspolice.net but with three extra fields:
latitude- This contains the latitude coordinate derived from the Location field, i.e. the data you found fortables/geocodes.psvlongitude- This contains the longitude coordinate derived from the Location field, i.e. the data you found fortables/geocodes.psvnarrative- Thisnarrativefield contains the contents of the associated PDF file with an incident.
The field names will be arranged/renamed like thus:
case_numberdatelocationsuspect_statussuspect_weaponsuspectsofficersgrand_jurylatitudelongitudenarrative
Check out the hints section for more information about the layout and process.
tables/officers.psv
This table is derived from incidents.psv and contains these columns:
case_numberdatesuspect_killedsuspect_weaponlast_namefirst_nameracegender
The suspect_killed field is set to TRUE if, in the incidents table, the suspect_status contains DECEASED in it (even if the incident had multiple suspects and only one was killed), and FALSE otherwise.
Each incident has one or more officer. From each incident, then, extract the list of officers and parse it, so that each officer has their own row in officers.psv. For example, in Case #36192Z, the Officer(s) column looks like this:
Deborst, Paul W/M Bacon, Mark W/M Canete, Daniel A/M
That cell would result in these three rows for officers.psv:
| case_number | date | suspect_killed | suspect_weapon | last_name | first_name | race | gender |
|---|---|---|---|---|---|---|---|
| 36192Z | 2/13/2012 | TRUE | Handgun | Deborst | Paul | W | M |
| 36192Z | 2/13/2012 | TRUE | Handgun | Bacon | Mark | W | M |
| 36192Z | 2/13/2012 | TRUE | Handgun | Canete | Daniel | A | M |
tables/suspects.psv
This is similar to officers.psv, except the names are derived from the Suspects(s) cell, and no suspect_killed (too difficult to parse from the basic table):
case_numberdatesuspect_weaponlast_namefirst_name
pagemaker.sh
This I leave up to mostly your discretion. But at a bare minimum, you need to create a webpage that contains three separate HTML tables, one each for suspects.psv, officers.psv, incidents.psv.
If you want to do a map, you could study the code for the basic Leaflet.js tutorials. I don’t assume any JavaScript knowledge from the class so it’s difficult to set a minimum bar here. But I think if you recognize where JSON can be used, you’ll find this easier than expected.
Background
In the wake of Michael Brown's shooting in Ferguson, Missouri, there has been increased attention to the topic of officer-involved shootings. However, what researchers and reporters have found is that there's not much data at all on the subject. Cue the Daily Show on Oct. 7, 2014:
The Daily Show
Get More: Daily Show Full Episodes,Indecision Political Humor,The Daily Show on Facebook
This is a pretty frequent theme in the news cycle: major tragedy happens, people want to find out more about related tragedies and what can be done to prevent them, people find out that no one's really keeping track. Check out this essay, What Slate learned from trying, and failing, to record every death by gun in America since Newtown.
The Fatal Encounters site was started with the intent of crowdsourcing "an impartial, comprehensive and searchable national database of people killed during interactions with law enforcement". Deadspin also jumped in. Wikipedia has a decent entry on the topic, though if you go into some of its separate entries on officer-involved deaths, you'll see this message:
This is an incomplete list that may never be able to satisfy particular standards for completeness.
Where are the official sources?
As the Washington Post reports, don't expect the Justice Department or the FBI to have a complete list:
But how many people in the United States were shot, or killed, by law enforcement officers during that year? No one knows.
Officials with the Justice Department keep no comprehensive database or record of police shootings, instead allowing the nation’s more than 17,000 law enforcement agencies to self-report officer-involved shootings as part of the FBI’s annual data on “justifiable homicides” by law enforcement.
That number – which only includes self-reported information from about 750 law enforcement agencies – hovers around 400 “justifiable homicides” by police officers each year. The DOJ’s Bureau of Justice Statistics also tracks “arrest-related deaths.” But the department stopped releasing those numbers after 2009, because, like the FBI data, they were widely regarded as unreliable.
“What’s there is crappy data,” said David A. Klinger, a former police officer and criminal justice professor at the University of Missouri who studies police use of force.
The Dallas Police Department
In the r/datasets subreddit, I came across this Github repo that's attempting to gather and cleanup the data found at the Dallas Police website. (Related: "Dallas police department releases 11 years of officer-involved shooting data")
As it turns out, the Dallas PD is one of the very few organizations to track these numbers. Philadelphia's police has a similar site, though less comprehensive records. Las Vegas lists incidents since 2010.
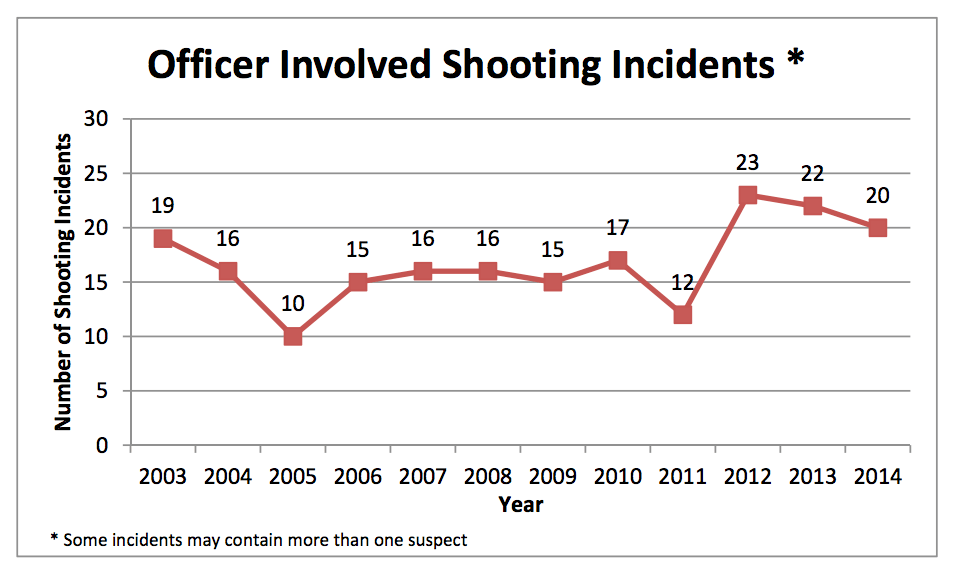
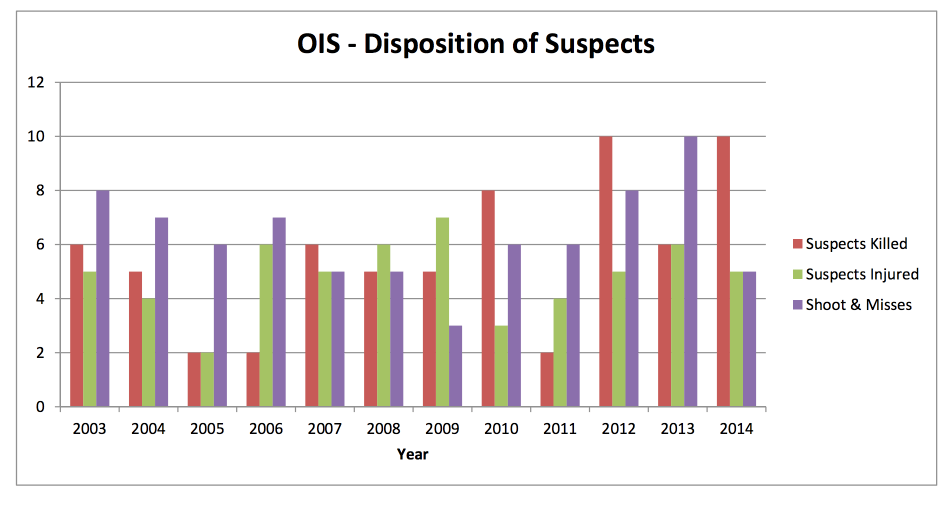
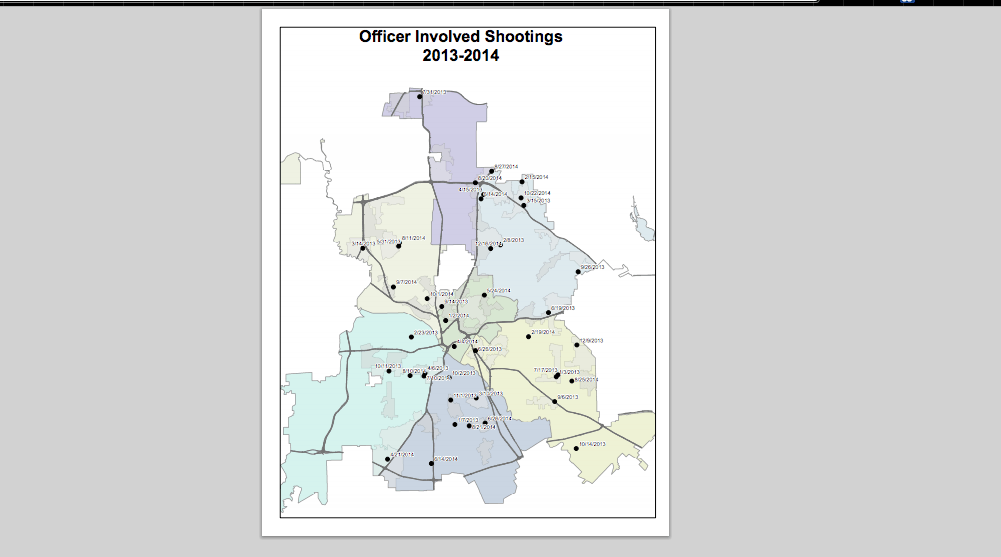
The Dallas PD's site contains some helpful charts and visualizations:
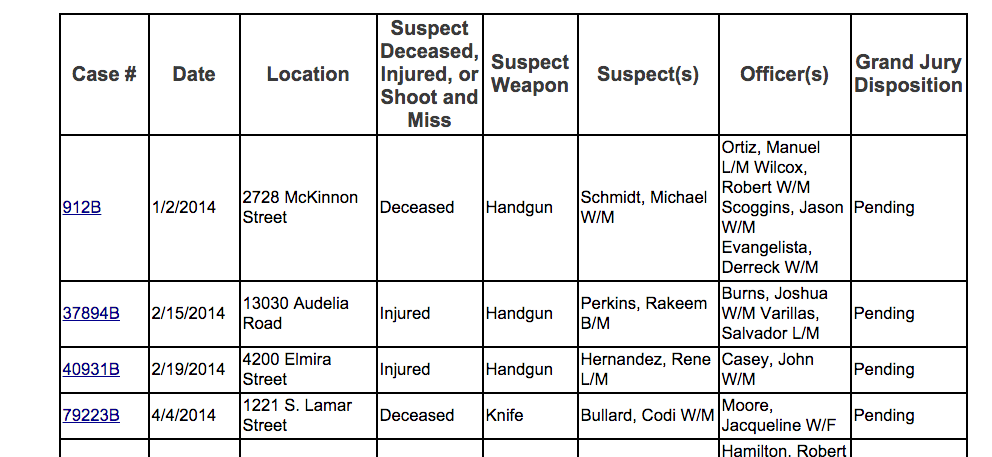
However, what's most valuable are the data tables, which look like this:
They're separated across different webpages, by year, so this assignment involves putting everything together in a manner similar to the /dallashooting repo on Github. The structure will be a bit different, though. Instead of creating one CSV file (you can view the /dallasshooting version here), we'll create three, in an attempt at pseudo-normalization so that it's easier to ask such questions as, "what are the demographics of the officers and suspects in officer-involved shootings". We'll also do a bit of data-augmentation process to practice our API-requesting skills by adding latitude and longitude to the incidents.psv table.
There's a lot of steps to this process, but none that you haven't done before. No matter the actual technical details, the main goal, as in past assignments, is:
- Public data is scarce and not organized in the way we often want it to be.
- There's value in being able to organize data to see the big picture.
The Dallas PD's OIS data is just one department, but having the self-reported records from a large metropolitan department is a good start to answering the pertinent questions of when and why law enforcement shootings happen, how they are handled in the judiciary process, and what changes, if any, have been made by a department to better prepare their officers. Combine this with the crowd-sourced "unofficial" efforts from groups like Fatal Encounters, and we can go a long way into increasing public accountability into this issue.
Hints
New hint: Web parsing
I keep forgetting that HTML parsing can be extremely hard from the command-line. So just use this snippet for turning the web tables into JSON, and work from there. (replace stuff.html with the name of the file you're trying to parse)
cat stuff.html | pup 'table table tr json{}' |
  jq '.[] .children | {
    case_pdf_href: .[0] .children[0] .href,
    case_id: .[0] .children[0] .text,
    date: .[1] .text ,
    address: .[2] .text,
    suspect_status: .[3] .text,
    suspect_weapons: .[4] .text,
    suspects: .[5] .text,
    officers: .[6] .text,
    grand_jury: .[7] .text
  }'
Actually you may find it easier just to go straight to CSV like this:
cat stuff.html | pup 'table table tr json{}' |
  jq  --raw-output '.[] .children | [
    .[0] .children[0] .href,
    .[0] .children[0] .text,
    .[1] .text ,
    .[2] .text,
    .[3] .text,
    .[4] .text,
    .[5] .text,
    .[6] .text,
    .[7] .text
  ] | @csv'
Putting things together
The most difficult part of this assignment will just be the act of putting things together, and by "things", I mean the literal text strings into pipe-delimited files.
read-while loops
Especially for the geocoder.sh script, you'll probably want to use the read-while pattern from a command. For example, assume you have a file named examples.txt that contains:
  2502 Grand Avenue
  2700 Medill Street
  17601 Marsh Lane
To iterate across each of those lines and do something for each line (i.e. like you would in a for-loop):
cat examples.txt | while read location_line; do
  echo "Doing something to $location_line"
done
Why pipe-delimited files?
Don't think of pipe-delimited files as anything different from CSVs. Except that instead of commas, these files use pipe-characters to separate the columns. Why pipes? It's a common convention. But why not commas? Because commas appear quite frequently in normal human-created text. Which means it requires extra logic when creating/parsing such files (hence, our reliance on tools like csvfix). The pipe character is relatively infrequently used (how often did you use it before this class?) and is somewhat safe. I guess if I really wanted to be safe, I'd make you delimit the files with the carat symbol…but again, sometimes that randomly pops up in human-produced text.
Hopefully no one at the Dallas Police Department is just using pipe-characters for the fun of it.
(note: the .psv extension is just cosmetic)
printf
The csvfix tool will be handy for reading our own PSV files. But you may find it more straightforward to produce PSV text using the printf tool:
somevar="Hello, world"
somevar2=42.2983213
somevar3=-102.502332
randomtext=$(curl -s http://www.example.com | tr '[:space:]' ' ')

printf 'Text|Latitude|Longitude|Text\n'
printf '%s|%s|%s|%s\n', "$somevar" "$somevar2" "$somevar3" "$randomtext"
This will also come in handy when producing the HTML tables.
Check out my brief tutorial on producing HTML programmatically for another example of printf, though you don't necessarily need to use the heredocs concept.
Geocoding
Geocoding an address can be as simple as using curl. Again, refer to the Google API docs for the request format. For this assignment, we'll just assume all addresses are in Dallas, Texas. So given a Location of 2502 Grand Avenue, the API request looks like this:
https://maps.googleapis.com/maps/api/geocode/json?address=2502+Grand+Avenue+Dallas+TX
A cached-version of the response can be found here:
http://stash.compciv.org/samples/google-geocode-2502grandavedallas.json.
Before you hit a live geocoding service, you should test your parsing command (i.e. use jq) on this URL, to make sure you can reliably extract the latitude and longitude.
The "Montage the world from the command-line with Google and Instagram" tutorial has an example of parsing the Google Geocoding response.
Feel free to use MapQuest's API, but for the rest of the examples, I'm just going to show Google's response.
Geocoding rate-limits
Google's geocoding API has a rate limit (as does MapQuest's). Which means two things:
- Since you are likely going to use a for-loop to produce the data for
tables/geocodes.psv, use the sleep command to pause between each request. - Make sure your calling/parsing code works manually for a few addresses. This means you test your parsing code (i.e. the part that extracts latitude/longitude) on a cached version of the geocoding data. You don't want to hit up the geocoding service and make successful requests and then find out later your parsing code was broken, and nothing was properly saved.
- Use the
sleepcommand to pause execution for a few seconds between each request.
A caching strategy
There aren't a huge number of locations to geocode (assuming 20-30 OIS incidents per year). But waiting for 300+ locations to geocode may take awhile. So you might want to write geocoder.sh to save each response to a folder in data-hold. Here's an example strategy (remember if/else statements?) that you could incorporate into a loop:
mkdir -p 'data-hold/geocodes'
some_location="2502 Grand Avenue"
# create a filename-safe slug, i.e. remove non-alphanum cahracters
some_slug=$(echo $some_location | sed s/[^A-z0-9]//g) # 2502GrandAvenue
some_filename="data-hold/geocodes/$some_slug.json"

# if file exists and is non-zero
# then we don't need to download it
if [[ -s "$some_filename" ]]; then
  echo "Already downloaded $some_filename"
else
  echo "Going to geocode the file"
  curl "http://WWW.EXAMPLE.COM/address=$some_location" > "$some_filename"
fi
Creating the narrative for incidents.psv
When scraper.sh is all done, you should have a data-hold/pdfs full of PDF files, one for each incident. Here's an example for the 2012 case number 36192Z:
(Forgotten how to convert a PDF into text? Review the death rows parsing assignment.)
There's a lot of interesting information in there that isn't on the web table. For now, we just want to throw it all into the incidents.psv for convenience. To make things easy, use the tr tool (or sed) to convert all newline characters into regular spaces. Of course, CSV files, as we've seen, can include newline characters. But it makes parsing such files a pain-in-the-ass. And the newlines for the narrative text aren't essential to preserve.
The row for the given incident, 3619Z (in the 2012 OIS data) should look like this in incidents.psv
case_number|date|location|suspect_status|suspect_weapon|suspects|officers|grand_jury|latitude|longitude|narrative
36192Z|2/13/2012|1180 N. St. Augustine Road|Deceased|Handgun|Banks, William B/M|Deborst, Paul W/M Bacon, Mark W/M Canete, Daniel A/M|No Bill|32.7323596|-96.656922|On Monday, February 13, 2014, at approximately 1:55 P.M., the suspect B/M/26 committed an aggravated robbery at 1515 S. Buckner Boulevard and was observed by plainclothes deployment officers. Uniformed patrol officers in marked vehicles attempted to conduct a felony traffic stop. The suspect fled from officers and a short vehicle pursuit ensued. The suspect exited his vehicle and fled on foot into the August Park Apartments located at 1180 N. St. Augustine Road. While rounding the corner of a building the suspect slipped and fell and while on the ground faced the officers and pointed a handgun at them. Two officers fired their weapons at the suspect and missed. The suspect ran around a second corner of the building and turned toward the officers and pointed his weapon at the officers. Three officers fired their weapon striking the suspect four times. The suspect was transported to Mesquite Regional Hospital and pronounced deceased. Suspect weapon was a 9MM, no rounds fired, and had 10 rounds in the gun. No officers were injured. Three officers fired a combined 22 rounds. Involved officers: A/M 5 years, 8 months service, W/M 10 years, 3 months service, W/M 4 years, 7 months service.
Non-printable characters in the PDF
New hint, 2015-03-08: The text in the PDFs don't have just regular newlines, i.e. \n, so look at the Unix tools entry for tr for the appropriate translation.
Splitting up the officers and suspects
New hint, 2015-03-08: This is probably one of the more annoying details, especially if you haven't made the leap to understanding intermediate-level regexes.
At the point that you're creating suspects.psv and officers.psv, I really don't have any idea of how you've structured your program. However, at some point, most likely within a read-while loop, you have to deal with this type of scenario:
officernames="Smith, James W/M Johnson, Mary Jo B/F Miller, Johnathan L/M"
And you need to somehow get each value into its own line:
Smith, James W/M
Johnson, Mary Jo B/F
Miller, Johnathan L/M
This is easier if you've somehow studied intermediate regex on your own but let's pretend you haven't. At this point, you have to make an assumption: that there are only M and F officers. So with only two such possible cases, then there's nothing wrong with hard-coding some kind of hack.
What kind of hack? Remember that we need to split this line, and any kind of splitting requires a delimiter. So let's just add our own. The following sed substitutions (which look ugly, because we have to escape the forward slashes in /M and /F), will add a pound sign, # to the end of each \M and \F (why a pound sign? Well, it can be any symbol we want)
echo $officernames | sed "s/\/M/\/M#/g" | sed "s/\/F/\/M#/g"
Result:
Smith, James W/M# Johnson, Mary Jo B/F# Miller, Johnathan L/M#
And now we just use grep's -o and -E options; again, this is one of many solutions, but here I'm expressing this pattern: match a contiguous sequence of characters that are not a pound sign
echo $officernames | sed "s/\/M/\/M#/g" | sed "s/\/F/\/M#/g" |
   grep -oE "[^#]+"
The result looks like this:
Smith, James W/M
 Johnson, Mary Jo B/M
 Miller, Johnathan L/M
Adding latitude and longitude to incidents.psv
You can do this with some kind of loop, iterating through each incident and grepping through your tables/geocodes.psv file. If you want to get fancy, you can also check out csvfix's join command, which behaves in a similar way to a SQL join.
(NOTE: As I mention in the deliverables, you may not need to create geocodes.psv and link it like this. So do whatever makes sense given how you've arranged your data.)
Pagemaking
I'll include more details here on how to make a webpage (note: At this point, just make an HTML table). Suffice to say, it doesn't have to be anything more complicated than producing a text file, which you know how to do.
Review these guides to HTML:
Producing the HTML tables is enough of an accomplishment, and I hope by doing so you can see how useful it is to quickly collect and aggregate data that is spread across different files. However, I wanted to give you an extra outlet to do something interesting. Is there something in the data that strikes you as worth turning into a chart? Go ahead. Check out the HighCharts JS library. Want to make a map? Check out LeafletJS.
For a more ready-out-of-the-box mapping/pagemaking solution, you could also try Google's Fusion Tables. I've written a couple of guides to that for other classes:
- Introduction to Data Mapping with Fusion Tables
- Intro to Data Mashing and Mapping with Google Fusion Tables
- Mapping the Big Apple's Big Macs, Coffee, and Donuts
Extracurricular parsing
For this assignment, I'm only making you extract the PDF narratives. But you should be able to see that there's a lot of interesting information in there that would be worth pulling out into its own table.
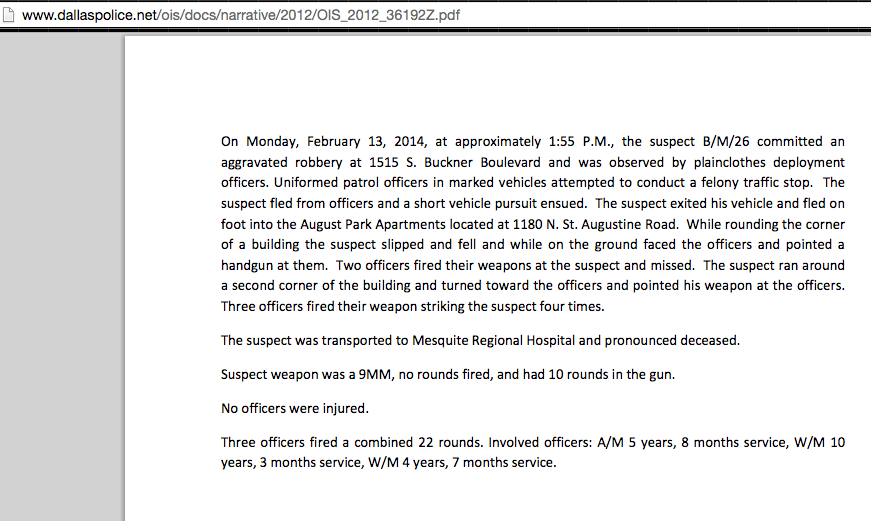
Here's the text for one incident:
On Monday, February 13, 2014, at approximately 1:55 P.M., the suspect B/M/26 committed an aggravated robbery at 1515 S. Buckner Boulevard and was observed by plainclothes deployment officers. Uniformed patrol officers in marked vehicles attempted to conduct a felony traffic stop. The suspect fled from officers and a short vehicle pursuit ensued. The suspect exited his vehicle and fled on foot into the August Park Apartments located at 1180 N. St. Augustine Road. While rounding the corner of a building the suspect slipped and fell and while on the ground faced the officers and pointed a handgun at them. Two officers fired their weapons at the suspect and missed. The suspect ran around a second corner of the building and turned toward the officers and pointed his weapon at the officers. Three officers fired their weapon striking the suspect four times.
The suspect was transported to Mesquite Regional Hospital and pronounced deceased.
Suspect weapon was a 9MM, no rounds fired, and had 10 rounds in the gun. No officers were injured.
Three officers fired a combined 22 rounds. Involved officers: A/M 5 years, 8 months service, W/M 10 years, 3 months service, W/M 4 years, 7 months service.
Consider the different data points that could be pulled out here:
- The time of the incident
- The suspected crime
- Was there a chase?
- Number of shots fired
- Number of shots hit
- The time of service for each involved officer
In a slightly-more advanced programming class, I would make you extract this information out into the incidents.psv and officers.psv. But it's not quite easy enough to do with just grep, but not too difficult to do with common programmatic techniques.
However, if you're interested in doing this as a final project, come talk to me.